Japan’s Two Contradictory Earthquake Warnings for the Nankai Trough — And Why Both Numbers Matter
In September two thousand and twenty five, Japan’s Headquarters for Earthquake Research Promotion published something that had never appeared in an official seismic risk document before: two different probability estimates for the same earthquake, listed side by side, with a statement that scientific superiority between the two models could not be determined.
The first number: sixty to ninety percent chance of a megaquake along the Nankai Trough within the next thirty years, or higher. The second: twenty to fifty percent, calculated using a different model applied to the same historical data. Both estimates sit in the highest tier of Japan’s three-level risk classification system. Both were published by the same committee. And neither was retracted.
This is not a scientific error. It is an honest acknowledgment that earthquake probability science, when applied to a fault with fewer than four complete rupture cycles in the historical record, reaches a point where uncertainty cannot be hidden behind a single figure.
What Is the Nankai Trough
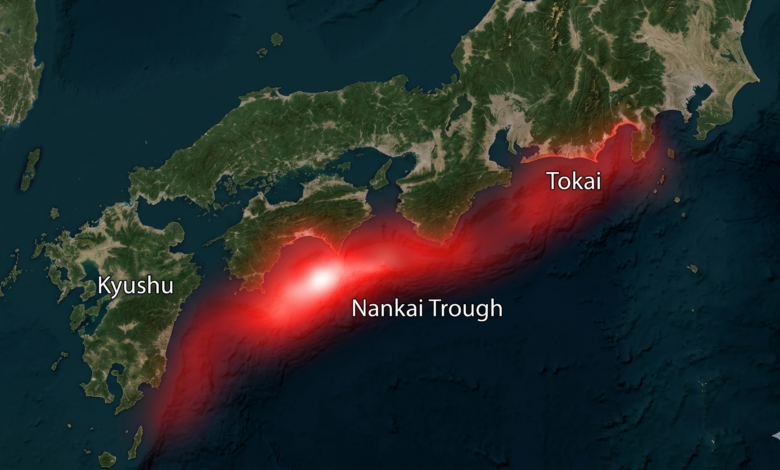
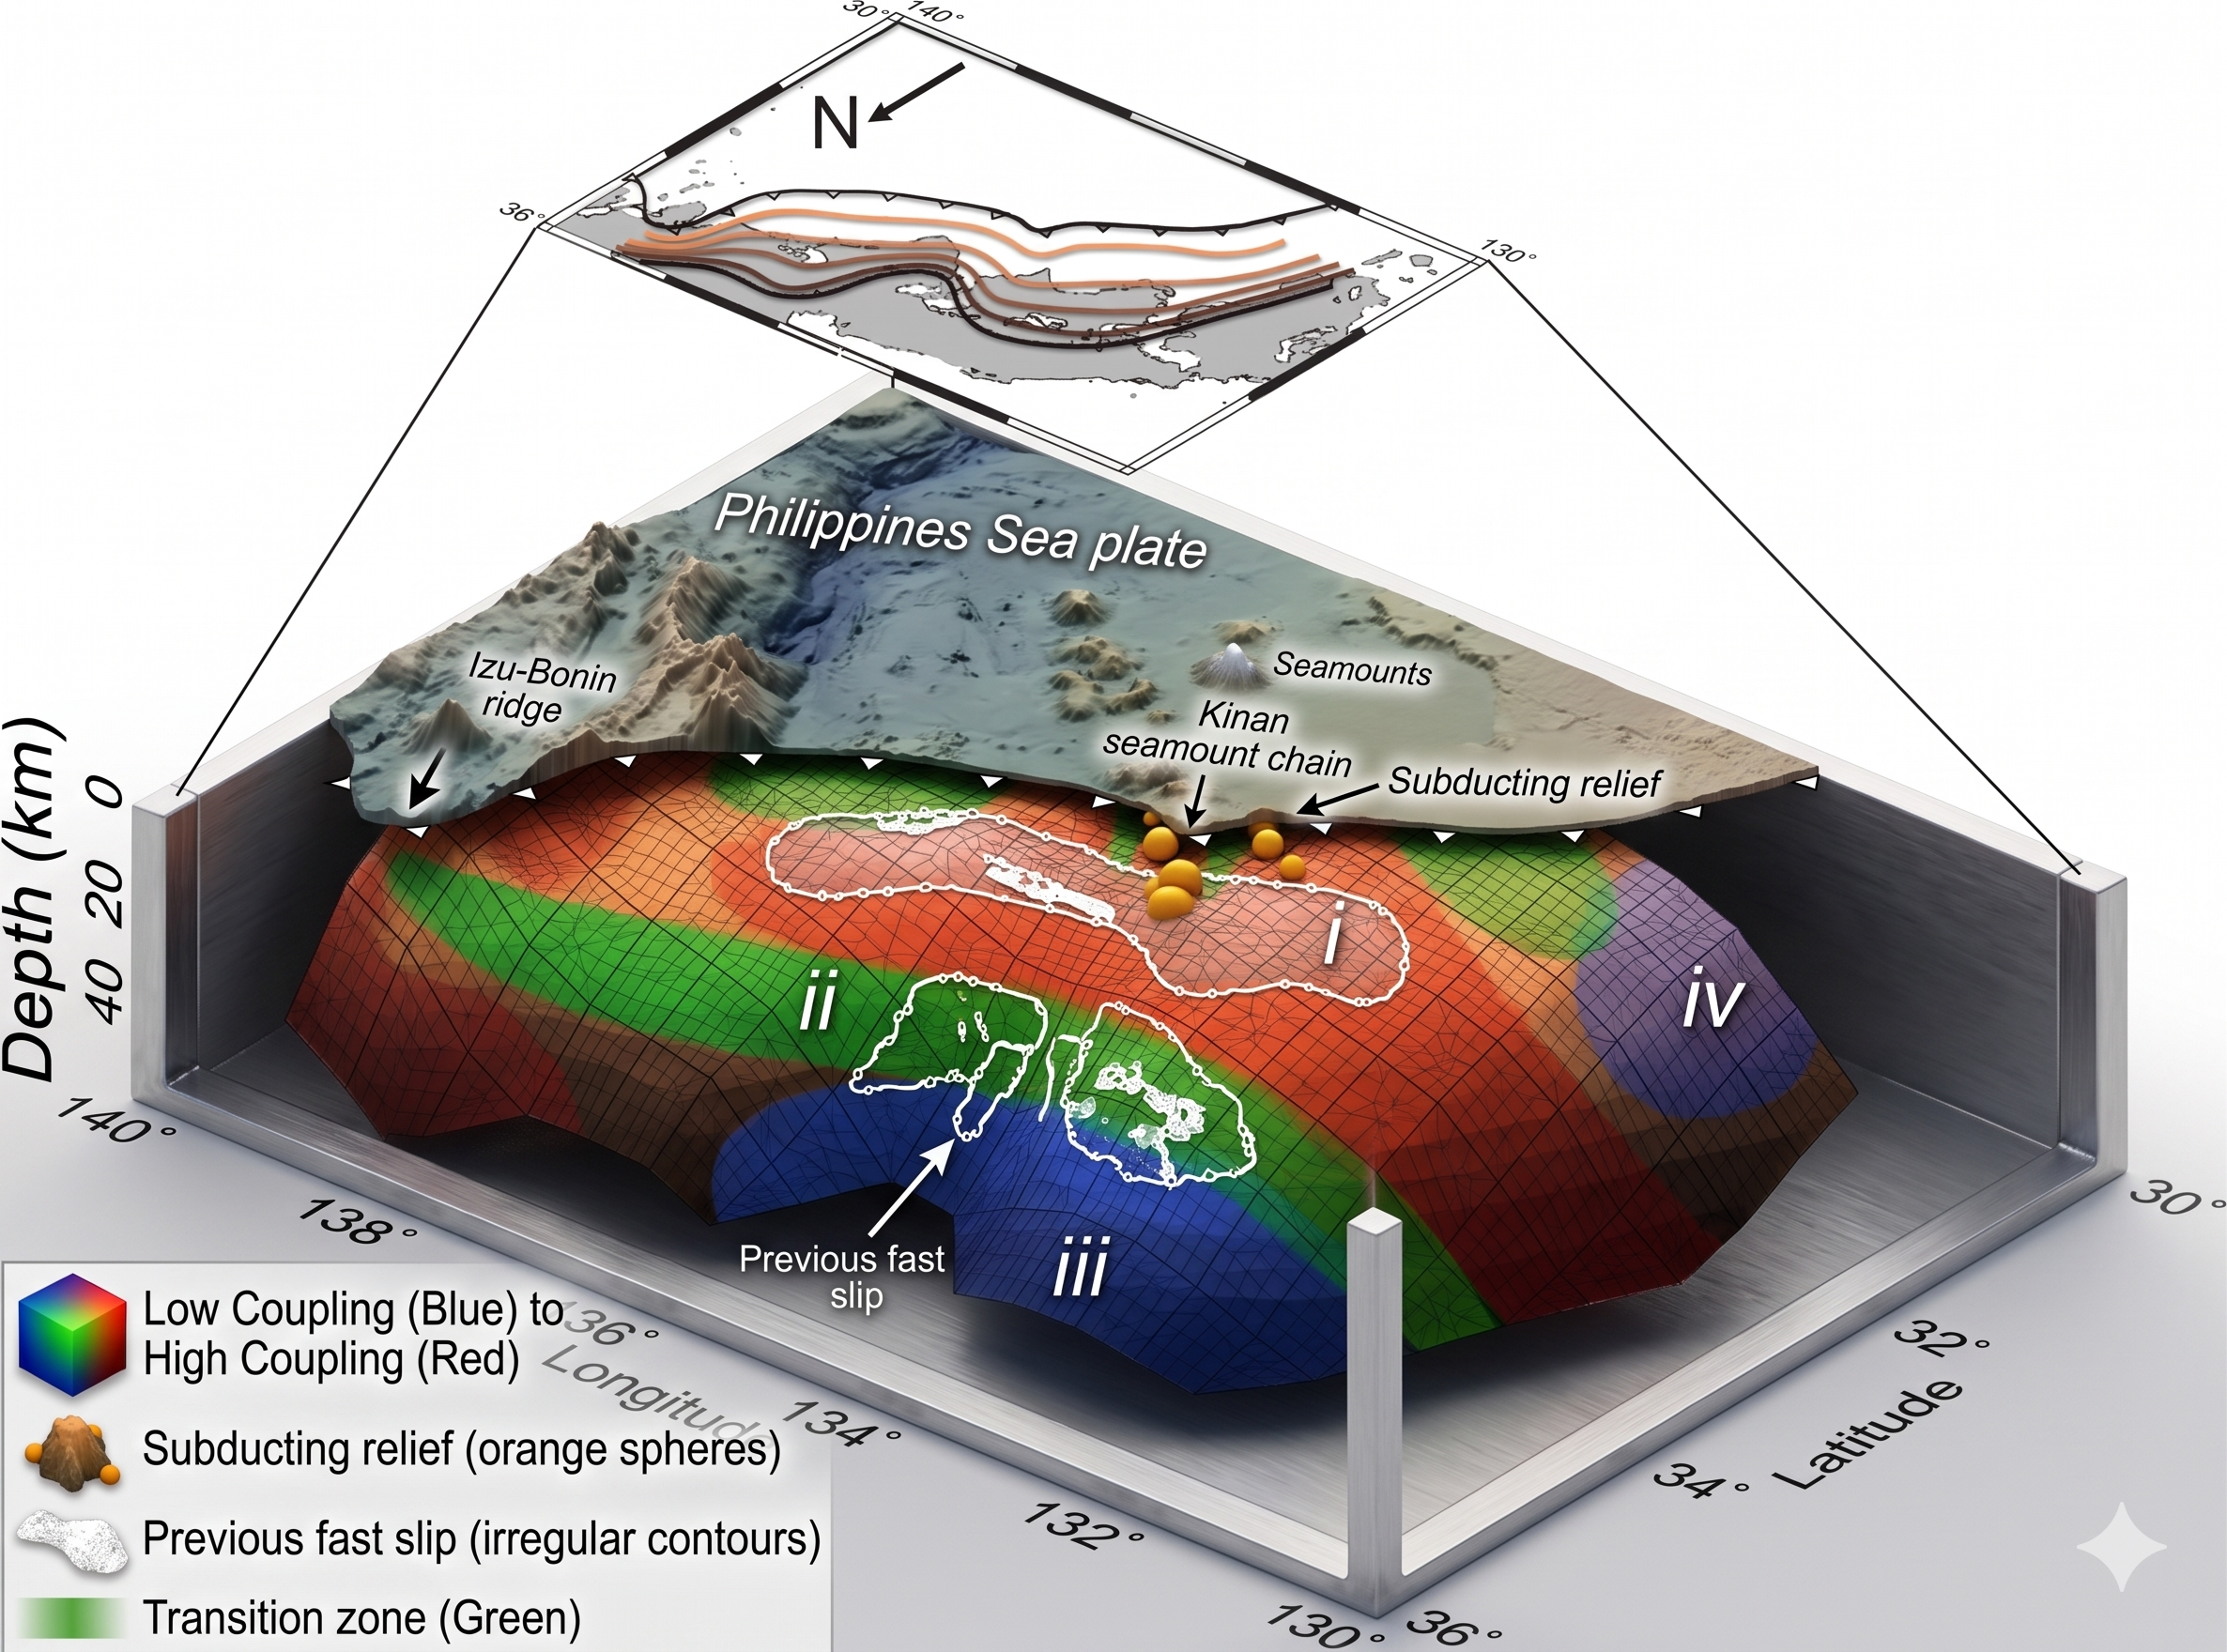
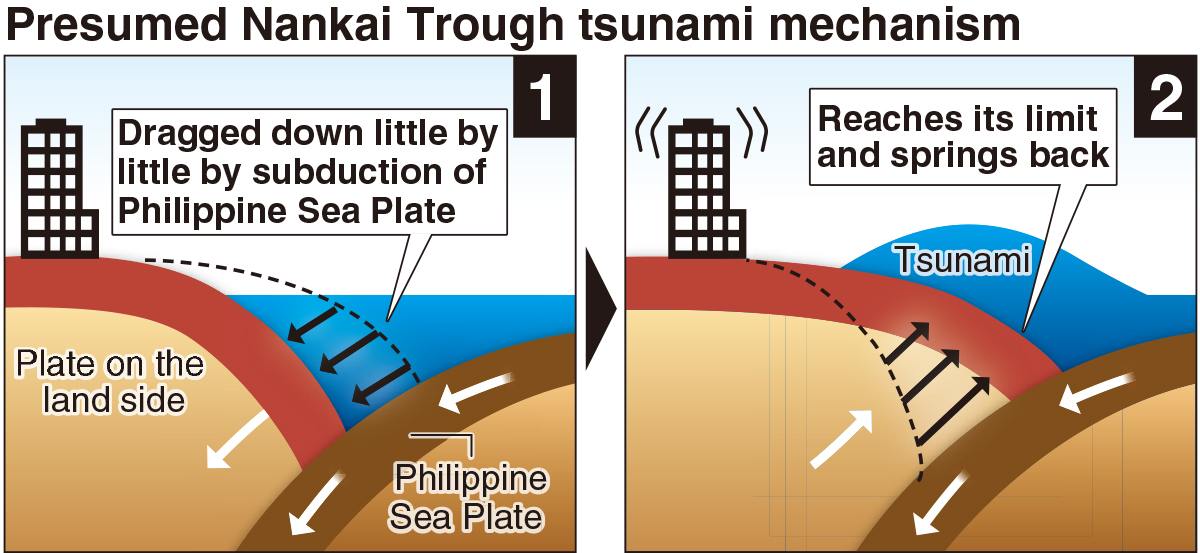
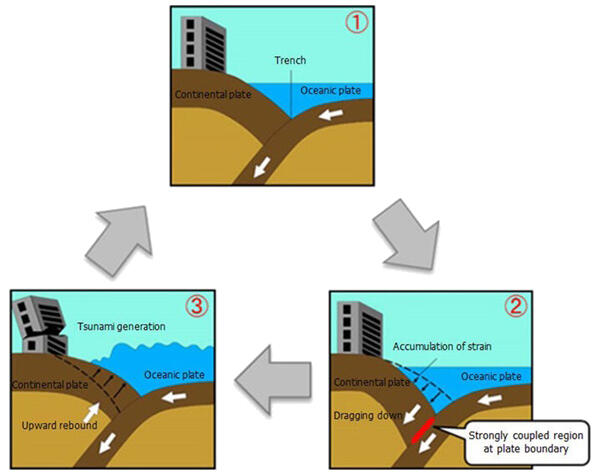
The Nankai Trough is an oceanic trench running approximately eight hundred kilometers (five hundred miles) along Japan’s Pacific coastline, from Suruga Bay in the northeast to the Hyuga Sea in the southwest. It marks the boundary where the Philippine Sea Plate subducts beneath the Amurian Plate at a rate of roughly four to six centimeters per year. That process does not pause. Stress accumulates continuously along the fault, and once every one hundred to one hundred and fifty years, the accumulated energy releases in the form of a major earthquake.
The last significant release occurred in nineteen forty four, when the Tonankai earthquake struck at magnitude seven point nine, followed two years later by the Nankai earthquake at magnitude eight point zero in December nineteen forty six. Eighty years have passed since that sequence. The historical recurrence window is open.
The Historical Record
The Nankai Trough has generated major earthquakes throughout recorded Japanese history. The most instructive example is the seventeen oh seven Hoei earthquake, estimated at magnitude eight point six to eight point nine, which remains the reference case for worst-case rupture scenarios. All five segments of the fault broke simultaneously in that event. Tsunamis devastated coastlines from Kyushu to the Boso Peninsula across roughly one thousand kilometers (six hundred and twenty miles). Forty nine days later, Mount Fuji erupted for the last time in recorded history, with ashfall reaching what is now Tokyo.
The direct causal link between the Hoei earthquake and the Fuji eruption has not been conclusively established through a specific geological mechanism, but the forty nine-day interval has made this one of the most studied episodes in Japanese geophysics. What is documented is that large-magnitude earthquakes can redistribute stress in nearby volcanic systems.
In eighteen fifty four, the fault ruptured in two stages: the Ansei-Tokai earthquake on December fourth and the Ansei-Nankai earthquake on December fifth, less than thirty two hours apart. In nineteen forty four and nineteen forty six, the pattern of sequential partial ruptures repeated. What seismologists have not been able to predict is whether the next cycle will follow the partial rupture sequence of nineteen forty four to forty six, or the simultaneous full-fault rupture of seventeen oh seven. That distinction determines the difference between catastrophic regional destruction and a generational event.
The Two Numbers Explained
The sixty to ninety percent estimate uses the BPT time-predictable model, calibrated against ground uplift data from Murotsu Port covering the three most recent complete rupture cycles: the seventeen oh seven Hoei earthquake, the eighteen fifty four Ansei pair, and the nineteen forty six Nankai earthquake. Three data points is a small statistical foundation for a system operating in century-scale cycles. When the committee applied the model used for other Japanese earthquake zones to the same historical base, the result was twenty to fifty percent.
The disagreement between the two models is not a disagreement about whether the risk is severe. Both numbers fall in Japan’s highest risk classification category, which starts at twenty six percent. The disagreement is about how to calculate precise probabilities from three historical examples spanning three centuries.
Committee chair Naoshi Hirata, professor emeritus at the University of Tokyo, stated following the publication that the situation remains one where a major quake could occur at any time and that strengthening disaster preparedness must continue.
Current Monitoring and Damage Projections
Japan’s most recent official damage projections, updated after the two thousand and twenty four Noto Peninsula earthquake, estimate up to two hundred and ninety eight thousand fatalities in a magnitude nine rupture scenario. Two hundred and fifteen thousand of those fatalities would be caused by tsunami. Thirteen coastal prefectures would face waves exceeding ten meters (thirty three feet). Areas vulnerable to flooding increased by thirty percent compared to previous projections after high-precision topographic data was incorporated.
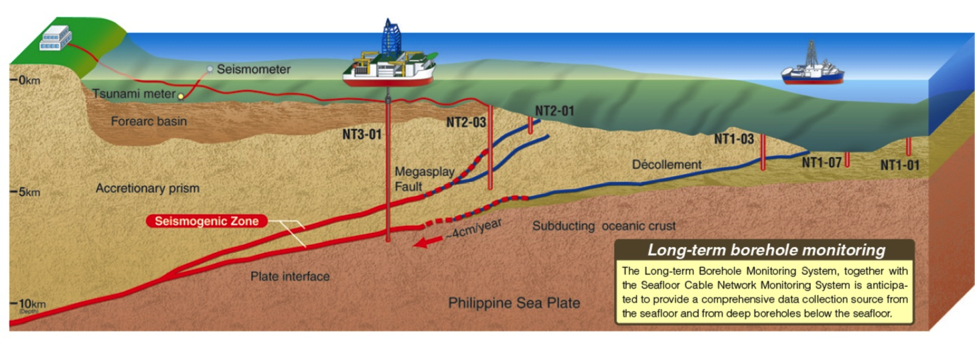
The Nankai Trough monitoring network regularly detects slow slip events: gradual, silent movements of the subducting plate occurring over hours or days with no surface shaking. Multiple slow slip events were recorded along different fault segments in two thousand and twenty three and two thousand and twenty four. In August two thousand and twenty four, a magnitude seven point one earthquake off Miyazaki triggered Japan’s first ever megaquake advisory from the Japan Meteorological Agency. The advisory was lifted days later without a subsequent major event, but it demonstrated that the monitoring system is calibrated and responsive.
Risks Beyond Japan
A full Nankai megaquake would generate tsunami propagation across the Pacific Ocean through verifiable physical mechanisms. Ocean wave propagation models project waves of one to three meters (three to ten feet) reaching Hawaii approximately eight hours after the main event, and the west coast of the United States within ten to twelve hours. The Philippines, Taiwan, and parts of eastern China’s coast would also receive smaller waves depending on the rupture pattern. These are documented projections based on wave physics, not speculation. What cannot be stated on current scientific grounds is that a Nankai rupture would directly trigger seismic activity on other Pacific subduction zones.
Japan’s preparedness infrastructure is among the most advanced on the planet. Seismic building resistance rates have risen from seventy nine percent in two thousand and eight to ninety percent in two thousand and twenty three. Earthquake early warning has been operational since two thousand and seven. Yet updated simulations show that in a full magnitude nine scenario, projected fatality numbers did not fall significantly despite these improvements. The reason is physics. A ten to thirty meter (thirty three to ninety eight foot) tsunami reaches some coastal communities in under ten minutes.
Publishing two contradictory probability estimates rather than one is an unusual choice in public risk communication. It reflects what the science actually shows: three historical data points, two competing models, and a fault that has ruptured consistently for over thirteen hundred years of recorded history. The Nankai Trough does not operate on human timelines, and the interval has never failed to end.